Population & Housing Growth in Campbell
Population: 43,095
Households: 16,628
Housing Units: 18,510
Source: California Department of Finance, 2024 Table E-5
Employed Residents: 23,720
Source: ACS 2023 5 year estimates
Race & Ethnicity in Campbell
White 52.5%
African American 1.4%
Asian 25.3%
Latino 18.9%
The Bay Area has a larger proportion of people of color than Campbell does
Source: ACS 2023 5 year estimates
Rate of population growth, 2010 to 2020: 6.5%
Rate of housing unit addition, 2010 to 2020: 7.1%
Source: California Department of Finance, Table E-5
Campbell’s population grew more slowly than Santa Clara County (9.2% increase), or the nine-county Bay Area region (8.6% increase).
The number of new homes built in Campbell and Santa Clara County has not kept pace with demand, resulting in longer commutes, increasing prices, and exacerbating issues of displacement and homelessness.
Housing Types in Campbell
A variety of housing types are necessary to meet the needs of a community. From 2010 to 2020, the number of single-family homes, generally the most expensive type of home, increased more than multi-family homes. Campbell’s proportion of detached single-family homes is higher than the region’s average.
Single family detached: 45.28%
Single family attached: 13.72%
Multifamily small (2-4 units): 10.89%
Multifamily large (5+ units): 28.47%
Mobilehomes: 1.64%
Source: California Department of Finance, 2024 Table E-5
Only 1.8% of Campbell’s housing stock is deed-restricted affordable housing.
| Extremely Low-Income | Very Low-Income | Low-Income | Moderate Income | Total Units | Affordable % of total Housing Stock |
| 0 | 78 | 56 | 199 | 333 | 1.8% |
SOURCE: Units reported in the Housing Element Annual Performance Report that received building permits through 2023 were added to the unit counts in the previously reported 2018 Base Year table. ELI units, if any, are included in the VLI category since that is how HCD required production data to be reported. The RHNA data on new units relies on self-reporting by jurisdiction and can include units for which building permits were issued that never got built. The percentage of the total housing stock in the community is based the California Department of Finance’s Table E-5. See more information on our affordable housing assets page.
Jobs & Housing in Campbell
Jobs-Housing Balance is a measurement used by planners that assumes that a balanced community is one where people can both live and work. This ratio compares the number of jobs in a community to the number of housing units.
Jobs-Housing Fit measures the mismatch between wages and housing affordability as the ratio of low-wage jobs (less than $3,333/month) to the number of low-cost rental units (less than $1,500/month). In Campbell, there are more than 6 low-wage workers competing for each affordable home.
Jobs: 21,848
Employed Residents per Household: 1.43
Jobs per Employed Resident: 1.40
Jobs-Housing Balance Ratio: 1.28 jobs per home
Source: ACS 2023 5 year estimates
Jobs-Housing Fit: 6.2 low wage jobs per low-cost rental
Source: Jobs from LEHD Origin-Destination Employment Statistics 2022; households from U.S. Census, ACS 2023 5 year estimates B25056, B25061
Renting & Cost Burden in Campbell
Current standards measure housing cost in relation to gross household income: households spending more than 30 percent of their income, including utilities, are generally considered to be overpaying or “cost burdened.”
Percent of population that rents: 49.46%
Source: ACS 2023 5 year estimates
Median monthly rent (1 bedroom apartment): $3,150
Rent change from 2024: +5%
Source: Zumper, February 2025
Severe cost burden occurs when households pay 50 percent or more of their gross income for housing.
30% – 50% income spent on housing (cost burdened)
42.51% of renter households (3,497)
24.09% of homeowner households (2,024)
> 50% of income spent on housing (severely cost burdened)
15.9% of renter households (1,308)
13.22% of homeowner households (1,111)
Source: ACS 2023 5 year estimates
The impact of high housing costs falls disproportionately on extremely low-, very low-, and low-income households, especially renters. While some higher-income households may choose to spend greater portions of their income for housing, the cost burden for lower-income households reflects choices limited by a lack of a sufficient supply of housing affordable to these households.
Homelessness in Campbell
2022: 216 people, all unsheltered (+191% from 2019)
2019: 74 people, all unsheltered (-21% from 2017)
Source: 2019 and 2022 Homeless Point In Time Count
Overcrowding in Campbell
Overcrowding increases health and safety concerns and stresses the condition of the housing stock and infrastructure. Overcrowding is strongly related to household size (particularly for large and very-large households) and the availability of suitably sized housing. Overcrowding impacts both owners and renters; however, renters are generally more significantly impacted.
Total Rental Homes: 8,225
Overcrowded Rental Homes: 498
Severely Overcrowded Rental Homes: 292
Percent of Rental Homes, Overcrowded: 9.6%
Source: ACS 2023 5 year estimates
Note: The U.S. Census defines an overcrowded unit as one occupied by 1.01 persons or more per room (excluding bathrooms and kitchens). Units with more than 1.5 persons per room are considered severely overcrowded.
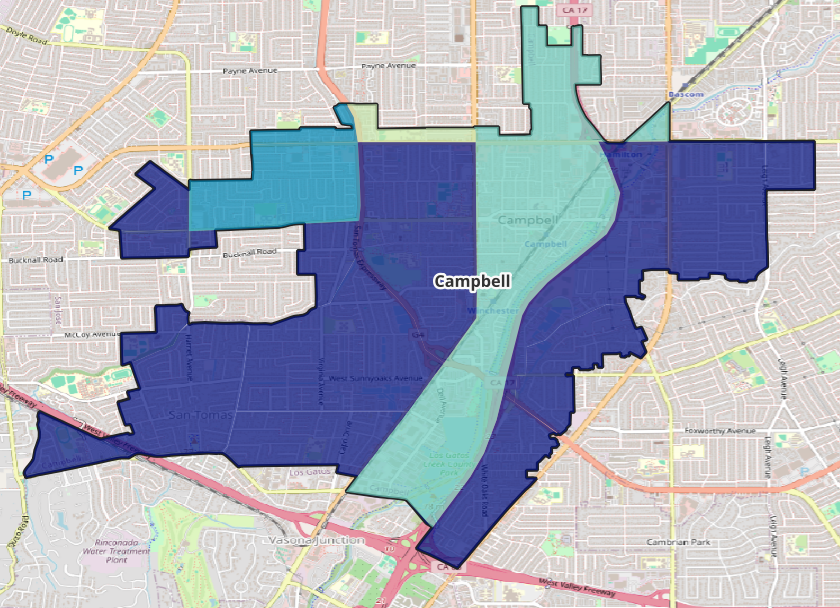
Resources in Campbell
Opportunity mapping is a way to measure and visualize place-based characteristics linked to critical life outcomes, such as educational attainment, earnings from employment, and economic mobility. This helps identify the areas where more affordable housing could expand access to existing resources for low-income households. Affordable housing developments located in High or Highest Resource areas are more likely to qualify for State funding. It is important to note that California’s affirmatively furthering fair housing (AFFH) law requires cities to both take actions that open high resource, previously exclusionary areas to lower-income residents, and also create policies and investment to transform racially and ethnically concentrated areas of poverty into areas of opportunity.
View more detailed maps on the California Tax Credit Allocation Committee’s website.
Regional Housing Needs Allocation (RHNA)
All California jurisdictions are required to create an 8-year plan (known as a Housing Element) to meet the housing needs of their residents, at all income levels. The Regional Housing Needs Allocation (RHNA) process is used to assign each city and county in California their “fair share” of the region’s new housing units, to make room for future growth and to ease our housing crisis. The current RHNA cycle, the state’s 6th, covers the period between January 1, 2023 and December 31, 2031.
Each year in April, cities report their progress to HCD in the Annual Progress Report (APR). The APR covers both the number of homes permitted by income level and progress on the dozens of critical programs that deploy a range of solutions to address the unique housing needs of residents. These programs, done well, create the solid foundation needed to achieve the RHNA.
The table below shows Campbell’s target in the sixth cycle and progress to date in permitting new homes.
| Affordability Level | RHNA | Permits Issued | Progress to RHNA |
| Very Low Income | 752 | 47 | 6.3% |
| Low Income | 434 | 43 | 9.9% |
| Moderate Income | 499 | 47 | 9.4% |
| Above Moderate Income | 1292 | 791 | 61.2% |
| Total | 2977 | 928 | 31.2% |
Permitting progress as of December 2024. Source: HCD 2024 Housing Element Implementation and APR Data Dashboard.
The table below shows Campbell’s target in the fifth cycle and final progress in permitting new homes.
| Affordability Level | RHNA | Permits Issued | Progress to RHNA |
| Very Low Income | 253 | 20 | 7.9% |
| Low Income | 138 | 12 | 8.7% |
| Moderate Income | 151 | 24 | 15.9% |
| Above Moderate Income | 391 | 654 | 167.3% |
| Total | 933 | 710 | 76.1% |
Permitting progress as of December 2022. Source: HCD 5th Cycle Housing Element Implementation and APR Data Dashboard.
Accessory Dwelling Units (ADUs)
ADUs and Junior Accessory Dwelling Units (JADUs) can be effective options for adding much needed housing in California, gently increasing density by adding more homes to a single lot. All California cities and counties are required to permit ADUs and JADUs according to State law. Since 2016, State ADU laws have evolved to make new development more feasible. HCD provides clarity and consistency on State housing law through education, technical assistance, and enforcement. HCD’s 2025 Accessory Dwelling Unit Handbook provides the most up-to-date guidance on State ADU laws.
| 2017 | 2018 | 2019 | 2020 | 2021 | 2022 | 2023 | 2024 | Total |
| 3 | 3 | 9 | 17 | 39 | 53 | 48 | 70 | 242 |
Source: HCD 2024 Housing Element Implementation and APR Data Dashboard.
Key Affordable Housing Policies
The Housing Element of Campbell’s General Plan includes policies supporting affordable housing. Current policies include:
Additional Resources
- City of Campbell General Plan 2040
- City of Campbell 2023-2031 Housing Element
- City of Campbell Inclusionary Housing Ordinance
- City of Campbell Accessory Dwelling Unit Ordinance
- City of Campbell Housing Division
- City of Campbell Planning Division