San Jose is experiencing a tremendous amount of development and pre-development activity. (Pre-development projects have been reported in the news, but have not yet filed a formal application with the city for entitlement). Knowing about the anticipated growth that may be coming is important for thinking about the challenges ahead, such as the proportion of new jobs to new homes, whether those homes will be affordable to those working in the jobs created, and what opportunities exist to maximize the amount of affordable housing. With this in mind, SV@Home tracks San Jose’s development activity closely.
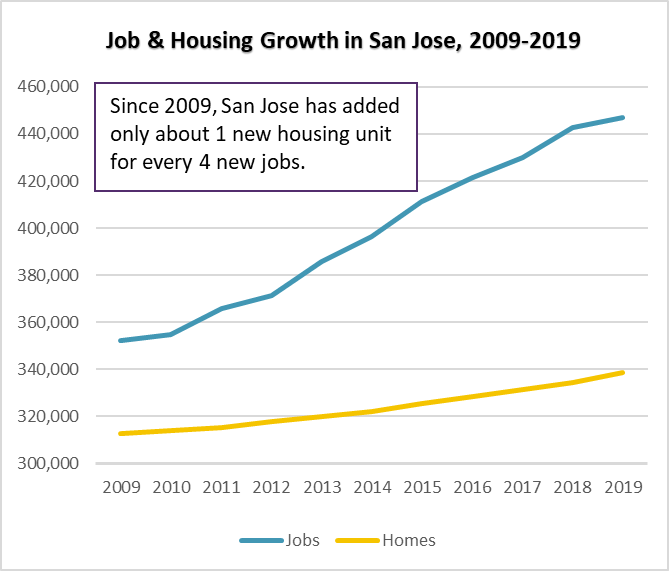
The table below summarizes the development and pre-development activity in San Jose as of August 2022. Overall, San Jose has about 3.8 jobs in the pipeline for each housing unit, a proportion that mirrors the relationship between jobs and housing growth over the past decade and continues to increase our housing shortage. While there is no one scientific standard to the ratio of employed residents to housing units, SV@Home recommends a proportion of 1.4 new jobs to new homes.
Many approved projects may take years to be completed. Some, like Google’s proposed development at Diridon Station in San Jose, will take a decade or more to build out.
| Pre-Application* | Application Submitted | Approved Projects | Under Construction | Total Jobs | |
| Downtown (except Diridon + Google) & N. 1st St. Urban Village | 10,736 | 4,342 | 32,210 | 6,997 | 54,285 |
| Diridon + Google + The Alameda (East) Urban Village | 11,652 | 5,316 | 34,382 | 3,929 | 55,279 |
| North San Jose & Alviso | 8,019 | 5,967 | 17,759 | 2,642 | 31,745 |
| Westside** | 6,709 | 2,230 | 4,188 | 2,597 | 15,724 |
| All Other Areas of the City | 2,215 | 4,367 | 15,467 | 992 | 23,041 |
| Total | 39,331 | 22,222 | 104,006 | 17,157 | 180,074 |
| Pre Application* | Application Submitted | Approved Projects | Under Construction | Total | |
| Downtown (except Diridon + Google) & N. 1st St. Urban Village | 2,302 | 2,444 | 4,524 | 764 | 10,034 |
| Diridon + Google + The Alameda (East) Urban Village | 3,643 | 1,327 | 5,602 | 330 | 10,902 |
| North San Jose & Alviso | 1,348 | 1,480 | 0 | 0 | 2,828 |
| Westside** | 873 | 1,925 | 3,505 | 950 | 7,253 |
| Other Areas of the City | 5,524 | 2,964 | 5,615 | 2,608 | 16,711 |
| Total | 13,690 | 10,140 | 19,246 | 4,652 | 47,728 |
*”Pre-Application” means that no application was on file as of January 1, 2022 but the project was in the news.
** “WESTSIDE” includes: all of West Valley west of Highway 17/880; the W. San Carlos St., Race Street Light Rail, South Bascom (North), and Southwest Expressway Urban Villages; and the Midtown Specific Plan area.
Jobs and Residential Development Pipelines as of March 2022 from the City of San Jose: San Jose’s website includes only “major” projects: 50+ dwelling units; 25,000+ square feet for commercial development; and 75,000+ square feet for industrial/office development. San Jose is the only jurisdiction for which the data is broken down into subareas, reflecting the City’s much larger geographical area as compared with other jurisdictions.