
ABAG’s Housing Methodology Committee began to hold public meetings in October of 2019 to decide how to divide the HCD’s Regional Housing Need Determination among the Bay Area’s 101 cities and 9 counties. The Methodology Committee is made up of members from every county in the region and includes elected officials, housing and planning staff from local jurisdictions, regional stakeholders, and a partner from the state government. The inclusion of diverse perspectives is designed to facilitate collaboration and information sharing and produce a fair, equitable methodology.
During this cycle, the Methodology Committee has considered ten potential factors as bases for deciding how to allocate housing, including access to high-opportunity areas, job proximity, and the jobs-housing balance. SV@Home, along with our partners at California YIMBY and seven other housing advocacy groups, recommends that the two factors receiving the most weight in determining where housing is allocated are access to High Opportunity Areas and job proximity.
Over the course of ten meetings, the Committee decided which factors are most relevant and how much weight to give each factor in determining the proposed methodology. On September 18, 2020, the Methodology Committee agreed on the recommended RHNA methodology they will submit to the ABAG Executive Committee.
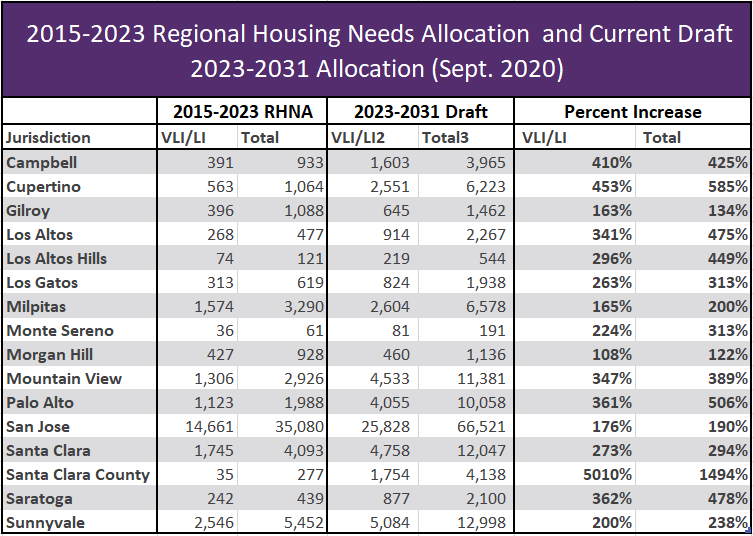
The draft methodology allocates Very Low Income (VLI) and Low Income (LI) housing units based on High Opportunity Areas (70%), Proximity to Jobs via Auto (15%), and Proximity to Jobs via Transit (15%). Moderate and Market Rate homes are allocated based on High Opportunity Areas (40%) and Proximity to Jobs via Auto (60%). Because the Regional Housing Need Determination is much higher than the last planning cycle, almost all jurisdictions will see a substantial increase in their RHNA for the 2023-2031 cycle. Weighing the allocation heavily toward high opportunity areas will result in large numbers, especially in the lower income categories, for areas rich in jobs and good schools.
The chart below compares the RHNA for the 2015-2023 cycle to the potential RHNA for 2023-2031, based on the proposed methodology.
Visit the Housing Methodology Committee’s visualization tool for exploring factor weighting and allocation outcomes to delve into how the different potential factors interact.